Image:Ice Age Temperature.png
From Wikipedia, the free encyclopedia
Ice_Age_Temperature.png (564 × 377 pixel, file size: 27 KB, MIME type: image/png)
Description


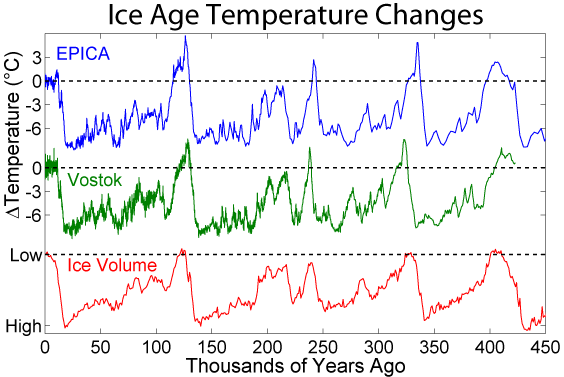
This figure shows the Antarctic temperature changes during the last several glacial/interglacial cycles of the present ice age and a comparison to changes in global ice volume. The present day is on the left.
The first two curves shows local changes in temperature at two sites in Antarctica as derived from deuterium isotopic measurements (δD) on ice cores (EPICA Community Members 2004, Petit et al. 1999). The final plot shows a reconstruction of global ice volume based on δ18O measurements on benthic foraminifera from a composite of globally distributed sediment cores and is scaled to match the scale of fluctuations in Antarctic temperature (Lisiecki and Raymo 2005). Note that changes in global ice volume and changes in Antarctic temperature are highly correlated, so one is a good estimate of the other, but differences in the sediment record do not necessarily reflect differences in paleotemperature. Horizontal lines indicate modern temperatures and ice volume. Differences in the alignment of various features reflect dating uncertainty and do not indicate different timing at different sites.
The Antarctic temperature records indicate that the present interglacial is relatively cool compared to previous interglacials, at least at these sites. The Liesecki & Raymo (2005) sediment reconstruction does not indicate significant differences between modern ice volume and previous interglacials, though some other studies do report slightly lower ice volumes / higher sea levels during the 120 ka and 400 ka interglacials (Karner et al. 2001, Hearty and Kaufman 2000).
It should be noted that temperature changes at the typical equatorial site are believed to have been significantly less than the changes observed at high latitude.
Copyright
This figure was produced by Robert A. Rohde from publicly available data and is incorporated into the Global Warming Art project.
This image is an original work created for Global Warming Art.
Permission is granted to copy, distribute and/or modify this image under either:
- The GNU Free Documentation License Version 1.2; with no Invariant Sections, Front-Cover Texts, or Back-Cover Texts.
- The Creative Commons Attribution-NonCommercial-ShareAlike License Version 2.5
Please refer to the image description page on Global Warming Art for more information
- http://www.globalwarmingart.com/wiki/Image:Ice_Age_Temperature.png
References
- Petit J.R., Jouzel J., Raynaud D., Barkov N.I., Barnola J.M., Basile I., Bender M., Chappellaz J., Davis J., Delaygue G., Delmotte M., Kotlyakov V.M., Legrand M., Lipenkov V., Lorius C., Pépin L., Ritz C., Saltzman E., Stievenard M. (1999) Climate and Atmospheric History of the Past 420,000 years from the Vostok Ice Core, Antarctica, Nature, 399, 429-436.
- EPICA community members (2004) Eight glacial cycles from an Antarctic ice core, Nature 429:6992, 623-628, doi:10.1038/nature02599.
- Lisiecki, L. E., and M. E. Raymo (2005), A Pliocene-Pleistocene stack of 57 globally distributed benthic d18O records, Paleoceanography, 20, PA1003, doi:10.1029/2004PA001071.
- Hearty, P.J. and Kaufman, D.S. (2000) Whole-rock aminostratigraphy and Quaternary sea-level history of the Bahamas, Quaternary Research 54, 163-173.
- D. B. Karner, J. Levine, B. P. Medeiros, R. A. Muller (2002) Constucting a Stacked Benthic δ18O Record, Paleoceanography 17:0, doi:10.1029/2001PA000667.
| Dragons flight's Temperature Record Series |
| This figure is part of series of plots created by Dragons flight to illustrate changes in Earth's temperature and climate across many different time scales. |
| Time Period: 25 yrs | 150 yrs | 1 kyr | 2 kyr | 12 kyr | 450 kyr | 5 Myr | 65 Myr | 500 Myr |
| For articles related to this topic see: Temperature record |
File history
Legend: (cur) = this is the current file, (del) = delete this old version, (rev) = revert to this old version.
Click on date to download the file or see the image uploaded on that date.
- (del) (cur) 20:27, 13 March 2005 . . Dragons flight ( Talk | contribs) . . 564×377 (27,191 bytes) (Better Version)
- (del) (rev) 19:27, 13 March 2005 . . Dragons flight ( Talk | contribs) . . 566×382 (26,942 bytes) (Ice Age Temperatures {{gfdl}})
-
Edit this file using an external application
See the setup instructions for more information.
File links
- Ice age
- Talk:Human migration
- Neanderthal interaction with Cro-Magnons
- Temperature record
- User:Dragons flight/Images
- Image:Five Myr Climate Change.png
- Image:Holocene Temperature Variations.png
- Wikipedia:Reference desk archive/July 2005 II
- Global warming
- User talk:Blue Tie/Article to work
Category: Global Warming Art images