Image:2000 Year Temperature Comparison.png
From Wikipedia, the free encyclopedia
2000_Year_Temperature_Comparison.png (600 × 443 pixel, file size: 39 KB, MIME type: image/png)
Contents |
Description


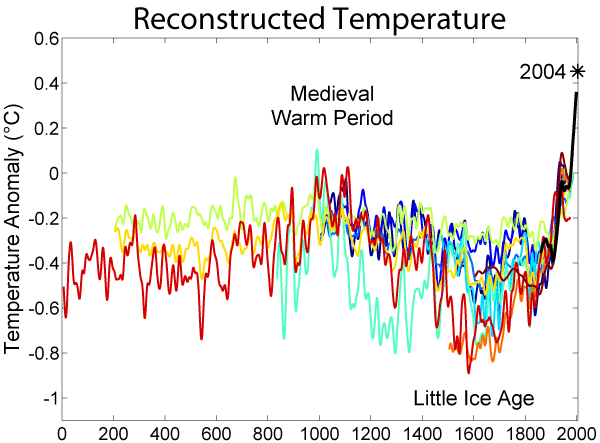
This graph is a comparison of 10 different published reconstructions of mean temperature changes during the last 2000 years. More recent reconstructions are plotted towards the front and in redder colors, older reconstructions appear towards the back and in bluer colors. The medieval warm period and little ice age are labeled at roughly the times when they are historically believed to occur, though it is still disputed whether these were truly global or only regional events. The single, unsmoothed annual value for 2004 is also shown for comparison. (Image:Instrumental Temperature Record.png shows how 2004 relates to other recent years).
For the purposes of this comparison, the author is agnostic as to which, if any, of the reconstructions of global mean temperature is an accurate reflection of temperature fluctuations during the last 2000 years. However, since this plot is a fair representation of the range of reconstructions appearing in the published scientific literature, it is likely that such reconstructions, accurate or not, will play a significant role in the ongoing discussions of global climate change and global warming.
For each reconstruction, the raw data has been decadally smoothed with a σ = 5 yr Gaussian weighted moving average. Also, each reconstruction was adjusted so that its mean matched the mean of the instrumental record during the period of overlap. The instrumental data are anomalies from the 1950-80 reference period. The variance (i.e. the scale of fluctuations) was not adjusted (except in one case noted below).
Except as noted below, all original data for this comparison comes from and links therein. It should also be noted that many reconstructions of past climate report substantial error bars, which are not represented on this figure.
Reconstructions
The reconstructions used, in order from oldest to most recent publication are:
- (dark blue 1000-1991): P.D. Jones, K.R. Briffa, T.P. Barnett, and S.F.B. Tett (1998). "High-resolution Palaeoclimatic Records for the last Millennium: Interpretation, Integration and Comparison with General Circulation Model Control-run Temperatures". The Holocene 8: 455-471. DOI: 10.1191/095968398667194956
- (blue 1000-1980): M.E. Mann, R.S. Bradley, and M.K. Hughes (1999). "Northern Hemisphere Temperatures During the Past Millennium: Inferences, Uncertainties, and Limitations". Geophysical Research Letters 26 (6): 759-762. DOI: 10.1029/1999GL900070 ( pre-print)
- (light blue 1000-1965): Crowley and Lowery (2000). "Northern Hemisphere Temperature Reconstruction". Ambio 29: 51-54. Modified as published in Crowley (2000). "Causes of Climate Change Over the Past 1000 Years". Science 289: 270-277. DOI: 10.1126/science.289.5477.270 (data available from NCDC : )
- (lightest blue 1402-1960): K.R. Briffa, T.J. Osborn, F.H. Schweingruber, I.C. Harris, P.D. Jones, S.G. Shiyatov, S.G. and E.A. Vaganov (2001). "Low-frequency temperature variations from a northern tree-ring density network". J. Geophys. Res. 106: 2929-2941. DOI: 10.1029/2000JD900617
- (light green 831-1992): J. Esper, E.R. Cook, and F.H. Schweingruber (2002). "Low-Frequency Signals in Long Tree-Ring Chronologies for Reconstructing Past Temperature Variability". Science 295 (5563): 2250-2253. DOI: 10.1126/science.1066208
- (yellow 200-1980): M.E. Mann and P.D. Jones (2003). "Global Surface Temperatures over the Past Two Millennia". Geophysical Research Letters 30 (15): 1820. DOI: 10.1029/2003GL017814.
- (orange 200-1995): P.D. Jones and M.E. Mann (2004). "Climate Over Past Millennia". Reviews of Geophysics 42: RG2002. DOI: 10.1029/2003RG000143
- (red-orange 1500-1980): S. Huang (2004). "Merging Information from Different Resources for New Insights into Climate Change in the Past and Future". Geophys. Res Lett. 31: L13205. DOI: 10.1029/2004GL019781
- (red 1-1979): A. Moberg, D.M. Sonechkin, K. Holmgren, N.M. Datsenko and W. Karlén (2005). "Highly variable Northern Hemisphere temperatures reconstructed from low- and high-resolution proxy data". Nature 443: 613-617. DOI: 10.1038/nature03265
- (dark red 1600-1990): J.H. Oerlemans (2005). "Extracting a Climate Signal from 169 Glacier Records". Science 308: 675-677. DOI: 10.1126/science.1107046
- (black 1856-2004): Instrumental data was jointly compiled by the Climatic Research Unit and the UK Meteorological Office Hadley Centre. Global Annual Average data set TaveGL2v was used.
Documentation for the most recent update of the CRU/Hadley instrumental data set appears in: P.D. Jones and A. Moberg (2003). "Hemispheric and large-scale surface air temperature variations: An extensive revision and an update to 2001". Journal of Climate 16: 206-223. DOI: 10.1175/1520-0442(2003)016<0206:HALSSA>2.0.CO;2
Copyright
The original version of this figure was prepared by Robert A. Rohde from publicly available data, and is incorporated into the Global Warming Art project.
This image is an original work created for Global Warming Art.
Permission is granted to copy, distribute and/or modify this image under either:
- The GNU Free Documentation License Version 1.2; with no Invariant Sections, Front-Cover Texts, or Back-Cover Texts.
- The Creative Commons Attribution-NonCommercial-ShareAlike License Version 2.5
Please refer to the image description page on Global Warming Art for more information
- http://www.globalwarmingart.com/wiki/Image:2000_Year_Temperature_Comparison.png
Notes
- Data from Moberg et al. was taken directly from the supplemental information accompanying the Nature article.
- Data for Oerlemans was provided by William M. Connolley.
- Esper et al. reported only fluctuations in "arbitrary" units, so the variance in this record was rescaled to match the variance during the period of overlap with the instrumental record.
- When a paper included mulitple reconstructions, the global annually average temperature data was used. If this was not reported, then Northern Hemisphere annually averaged data was used.
- Four records appearing at were not used in preparing this graph for the following reasons:
- Mann et al. 98 was not included because Mann et al. 99 extended and updated that record.
- Briffa et al. 98 was not included because Briffa et al. 2001 extended and updated that record.
- Pollack et al. 98 was not included because the reported data was not found to be in a form that allowed for easy replotting.
- Mann et al. 2000 was not used because it did not include an original reconstruction covering at least the Northern Hemisphere.
External references
- http://www.ncdc.noaa.gov/paleo/recons.html
Related Images
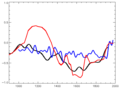 MWP and LIA in IPCC reports
|
| Dragons flight's Temperature Record Series |
| This figure is part of series of plots created by Dragons flight to illustrate changes in Earth's temperature and climate across many different time scales. |
| Time Period: 25 yrs | 150 yrs | 1 kyr | 2 kyr | 12 kyr | 450 kyr | 5 Myr | 65 Myr | 500 Myr |
| For articles related to this topic see: Temperature record |
File history
Legend: (cur) = this is the current file, (del) = delete this old version, (rev) = revert to this old version.
Click on date to download the file or see the image uploaded on that date.
- (del) (cur) 14:03, 3 February 2006 . . Dragons flight ( Talk | contribs) . . 600×443 (39,521 bytes)
-
Edit this file using an external application
See the setup instructions for more information.
File links
- Little Ice Age
- Medieval Warm Period
- Talk:Temperature record of the past 1000 years
- Temperature record
- User:Dragons flight/Images
- Image:Holocene Temperature Variations.png
- Global warming
- Image:1000 Year Temperature Comparison.png
- User talk:Blue Tie/Article to work
- User talk:Bottesini/archive4
- Wikipedia:Reference desk/Archives/Science/2006 November 12
- Talk:Race and intelligence/Archive 45
- Talk:Race and intelligence/Archive 49
Category: Global Warming Art images