Weather map
2007 Schools Wikipedia Selection. Related subjects: Climate and the Weather
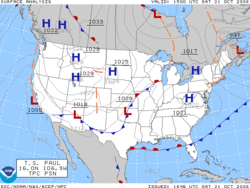
A weather map is a tool used to display information quickly showing the analysis of various meteorological quantities at various levels of the atmosphere. Maps utilizing isotherms show probable location of weather fronts. Isotach maps of the upper atmosphere show where the jet stream lies. Streamlines show areas of converging and diverging winds, particularly in the tropics. At the surface, the popular type of weather map is the surface weather analysis, which uses isobars to depict areas of high pressure and low pressure, as well as help locate weather fronts. Special weather maps in aviation show areas of icing and turbulence.
Uses
A weather map is used to depict a picture of the atmosphere at a specific time in the free atmosphere. They are used for the analysis and display of observations and computer analyses, including forecast fields derived by computer models. Forecast maps can be displayed for up to 14 days in the future to aid weather forecasters prepare forecasts of various parameters.
Plotted winds
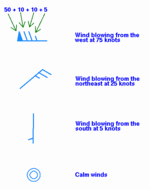
Winds have a standard notation when plotted on weather maps, whether they be of the surface, some higher level in the atmosphere, or to depict temperature or moisture advection. More than a century ago, winds were plotted as arrows, with feathers on just one side depicting five knots of wind, while feathers on both sides depicted 10 knots of wind. The notation changed to that of half of an arrow, with half of a flag depicting five knots and a full flag depicting 10 knots.
Types of analyses performed
Isobaric analysis
An isobaric analysis involves the construction of lines of equal mean sea level pressure, or isobars, on a geographic map. The innermost closed lines indicate the positions of relative maxima and minima in the pressure field. The minima are called low pressure areas while the maxima are called high pressure areas. Highs are depicted by blue H's while lows are depicted by red L's. Troughs of low pressure are depicted by thick, brown dashed lines down an elongation of lower pressure.
Isotach analysis
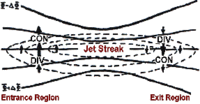
Isotachs are lines of equal wind speed drawn on weather maps. They are helpful in finding maxima and minima in the wind pattern. Minima in the wind pattern aloft are favorable for tropical cyclogenesis. Maximum in the wind pattern at various levels of the atmosphere show locations of the upper level jet stream and low level jets, both of which play a role in severe weather. Certain quadrants of upper level wind maxima are areas where upward vertical motion is preferred.
Isotherm analysis
Isotherms are lines of equal temperature drawn on weather maps. Isotherms are drawn normally as solid lines at a preferred temperature interval. They easily show areas of temperature gradient, which is useful in finding fronts, located normally at the warm edge of temperature gradients. They also show areas above and below freezing, which is useful in determination of precipitation type.
Streamline analysis
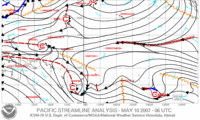
A streamline analysis is a series of arrows oriented parallel to wind, showing wind motion within a certain geographic area. C's depict cyclonic flow or likely areas of low pressure, while A's depict anticyclonic flow or likely positions of high pressure areas.
Types of weather maps
Surface weather analysis
A surface weather analysis is a type of weather map that depicts positions for high and low pressure areas including tropical cyclones, as well as various types of synoptic scale systems such as frontal zones, tropical waves, and dry lines. Mesoscale boundaries such as outflow boundaries and squall lines also are analyzed on surface weather analyses. Isobars are commonly used to place surface boundaries from the horse latitudes poleward, while streamline analyses are used in the tropics.
Aviation maps
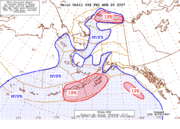
Aviation interests have their own set of weather maps. One type of map shows where VFR (visual flight rules) are in effect and where IFR (instrument flight rules) are in effect. Weather depiction plots show ceiling height (level where at least half the sky is covered with clouds) in hundreds of feet, present weather, and cloud cover. Icing maps are used to depict areas where icing can be a hazard for flying. Aviation-related maps also show areas of turbulence.
