Image:Gdp chart.png
From Wikipedia, the free encyclopedia
Gdp_chart.png (750 × 436 pixel, file size: 14 KB, MIME type: image/png)
Summary
| Description |
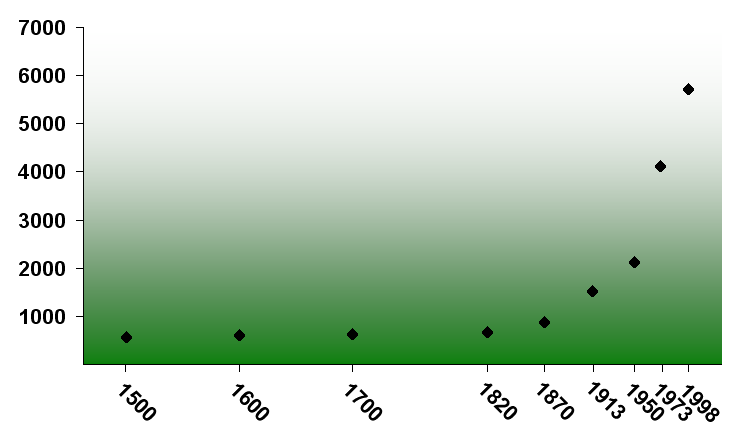
World GDP per capita between 1500 and 1998 expressed in the 1990's international dollars. Graph is derived from data in Table B-18. (World GDP) and Table B-10. (World Population) published in The World Economy: A Millennial Perspective by Angus Maddison, OECD, Paris 2001 ISBN 92-64-18998-X |
|---|---|
| Source |
self-made |
| Date |
2006-10-14 |
| Author |
-- Vision Thing -- |
| Permission |
|
Template:Convert to svg
Licensing

I, the creator of this work, hereby grant the permission to copy, distribute and/or modify this document under the terms of the GNU Free Documentation License, Version 1.2 or any later version published by the Free Software Foundation; with no Invariant Sections, no Front-Cover Texts, and no Back-Cover Texts.
Subject to disclaimers.
File history
Legend: (cur) = this is the current file, (del) = delete this old version, (rev) = revert to this old version.
Click on date to download the file or see the image uploaded on that date.
- (del) (cur) 17:28, 14 October 2006 . . Vision Thing ( Talk | contribs) . . 750×436 (14,614 bytes) ({{GFDL-self}})
-
Edit this file using an external application
See the setup instructions for more information.
File links
Category: User-created GFDL images