Image:Sine cosine plot.svg
From Wikipedia, the free encyclopedia
- Image
- File history
- File links
Sine_cosine_plot.svg (1200 × 800 pixel, file size: 57 KB, MIME type: image/svg+xml)
|
|
This is a file from the Wikimedia Commons. The description on its description page there is shown below. |
|
|
Summary
| Description |
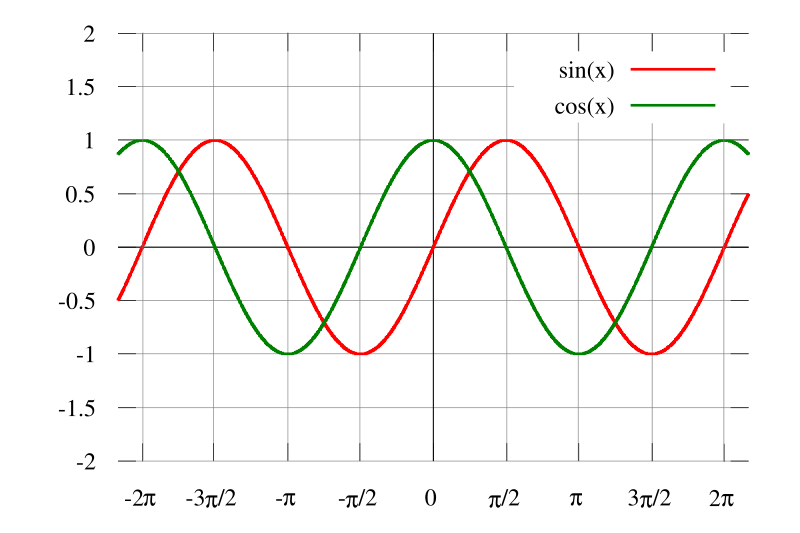
Plot of sine (red) and cosine (green) functions |
|---|---|
| Source |
Self-made using gnuplot and Inkscape |
| Date |
2006-06-94 |
| Author |
Qualc1 |
| Permission |
See below |
Instructions
Generated in gnuplot with the following script:
set terminal svg size 1200 800 fixed enhanced fname 'Times'  fsize 36
set output "sine_cosine_plot.svg"

set samples 10000

set xrange [-390:390]
set yrange [-2:2]

set grid
set xzeroaxis linetype -1 linewidth 1.5
set yzeroaxis linetype -1 linewidth 1.5

unset border
set angles degrees
plot sin(x) lw 4, cos(x) lw 4
Licensing
|

File links
- Trigonometric function
- Trigonometry
- Periodic function
- User:DJIndica/Sandbox