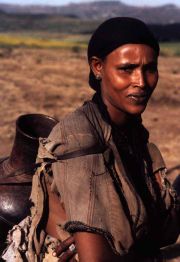
Demographics of Ethiopia
2007 Schools Wikipedia Selection. Related subjects: African Geography
Ethiopia's population is highly diverse. Most of its people speak a Semitic or Cushitic language. The Oromo, Amhara, and Tigrayans make up more than three-fourths of the population, but there are more than 80 different ethnic groups within Ethiopia. Some of these have as few as 10,000 members. In general, most of the Christians live in the highlands, while Muslims and adherents of traditional African religions tend to inhabit lowland regions. English is the most widely spoken foreign language and is taught in all secondary schools. Amharic was the language of primary school instruction but has been replaced in many areas by local languages such as Oromifa and Tigrinya.
Current demographic data
Population
CIA est. (2006): 74,777,981
CSA est. (2005): 75,067,000
UN est. (2005): 77,431,000
note: The latest census for which figures are available was performed in 1994; this figure is the July 2006 estimate, which take into account the effects of excess mortality due to AIDS; this can result in lower life expectancy, higher infant mortality and death rates, lower population and growth rates, and changes in the distribution of population by age and sex than would otherwise be expected.
Age structure
0-14 years: 43.7% (male 16,373,718; female 16,280,766)
15-64 years: 53.6% (male 19,999,482; female 20,077,014)
65 years and over: 2.7% (male 929,349; female 1,117,652) (2006 est.)
Population growth rate
2.31% (2006 est.)
Birth rate
37.98 births/1,000 population (2006 est.)
Death rate
14.86 deaths/1,000 population (2006 est.)
Net migration rate
0 migrant(s)/1,000 population (2006 est.)
note: repatriation of Ethiopians who fled to Sudan for refuge from war and famine in earlier years is expected to continue for several years; small numbers of Sudanese and Somali refugees, who fled to Ethiopia from the fighting or famine in their own countries, continue to return to their homes (2006 est.)
Sex ratio
at birth: 1.03 male(s)/female
under 15 years: 1.01 male(s)/female
15-64 years: 1 male(s)/female
65 years and over: 0.83 male(s)/female
total population: 1 male(s)/female (2006 est.)
Infant mortality rate
93.62 deaths/1,000 live births (2006 est.)
Life expectancy at birth
total population: 49.03 years
male: 47.86 years
female: 50.24 years (2006 est.)
Total fertility rate
5.22 children born/woman (2006 est.)
Nationality
noun: Ethiopian(s)
adjective: Ethiopian
Ethnic groups
Oromo 32.1%, Amhara 30.2%, Tigray 6.2%, Somali 6.0%, Gurage 4.3%, Sidama 3.4%, Wolayta 2%, Afar 2%, Hadiya 2%, Gamo 1%. (smaller groups are listed at Category:Ethnic groups in Ethiopia)
Religions
Christian 61.6% ( Ethiopian Orthodox 50.6%, Protestant 10.1% ( P'ent'ay and Ethiopian Orthodox Tehadeso Church), Catholic 0.9%), Muslim 32.8%, Traditional 5.6%.
Languages
Amharic 32.7% (as a first language), Oromigna 31.6%, Tigrinya 6.1%, Somali 6.0%, Guragigna 3.5%, Sidamo 3.5%, other local languages; Arabic, English (major foreign language taught in schools).
Literacy
definition: age 15 and over can read and write
total population: 42.7%
male: 50.3%
female: 35.1% (2003 est.)
Genetic studies
Most Y-chromosome haplotypes in Ethiopia are of E3b or one of its derivatives. It is extant in its highest level among the Oromo, where it represents 79.5% of the haplotypes, and it is also found at 45.8% among the Amhara. The haplogroup is thought to have originated in Ethiopia or elsewhere in the Horn of Africa, and it mostly characterized by E3b1 (M78). The haplogroup J is also found in high numbers in the Amhara and Tigray people. The haplogroup is characterised by the mutation 12f2a, and is thought to have originated and spread from the sub-Saharan Africa-linked Natufian culture. It is found at levels of about 35% among the Amhara, of which about 33% is of the type J-M267, almost all of which was acquired during Neolithic times or earlier, while 2% is of the derived J-M172 type representing admixture due to recent and historic migrations.
On the female line, Ethiopian mitochondrial DNA is 25% African, 25% Caucasoid, and 20% Indian Caucasoid, and 30% unknown.
A 2001 Oxford genetic cluster study stated: 62% of the Ethiopians fall in the first cluster, which encompasses the majority of the Jews, Norwegians and Armenians, indicating that placement of these individuals in a 'Black' cluster would be an inaccurate reflection of the genetic structure. Only 24% of the Ethiopians are placed in the cluster with the Bantu and most of the Afro-Caribbeans. In addition their craniofacial features resemble those of Caucasoids.|
