Image:Global Warming Predictions.png
From Wikipedia, the free encyclopedia
Global_Warming_Predictions.png (528 × 377 pixel, file size: 25 KB, MIME type: image/png)
Description

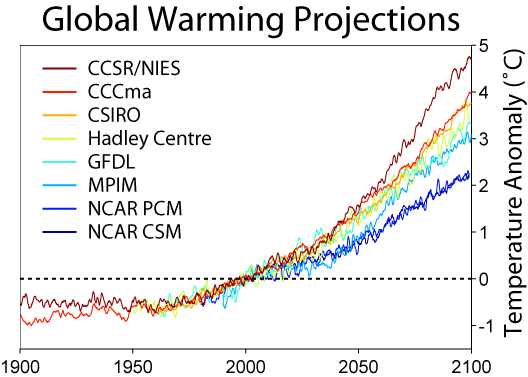
Shows climate model predictions for global warming under the SRES A2 emissions scenario relative to global average temperatures in 2000. The A2 scenario is characterized by a politically and socially diverse world that exhibits sustained economic growth but does not address the inequities between rich and poor nations, and takes no special actions to combat global warming or environmental change issues. This world in 2100 is characterized by large population (15 billion), high total energy use, and moderate levels of fossil fuel dependency (mostly coal). At the time of the IPCC Third Assessment Report, the A2 scenario was the most well-studied of the SRES scenarios that assumed no attempt to address global warming.
The IPCC predicts global temperature change of 1.4-5.8°C due to global warming from 1990-2100 . As evidenced above (a range of 2.5°C in 2100), much of this uncertainty results from disagreement among climate models, though additional uncertainty comes from different emissions scenarios.
| Temperature Increase 2000 to 2100 (°C) | |||
|---|---|---|---|
| Model | Total | Land | Ocean |
| CCSR/NIES | 4.7 | 7.0 | 3.8 |
| CCCma | 4.0 | 5.0 | 3.6 |
| CSIRO | 3.8 | 4.9 | 3.4 |
| Hadley Centre | 3.7 | 5.5 | 3.0 |
| GFDL | 3.3 | 4.2 | 3.0 |
| MPI-M | 3.0 | 4.6 | 2.4 |
| NCAR PCM | 2.3 | 3.1 | 2.0 |
| NCAR CSM | 2.2 | 2.7 | 2.0 |
Models
The model data used above was taken from the IPCC-DDC, and the models are as follows:
- CCSR/NIES: Centre for Climate System Research & National Institute for Environmental Studies, , CCSR/NIES AGCM + CCSR OGCM Models 1890-2100
- CCCma: Canadian Centre for Climate Modelling and Analysis , CGCm2 Model 1900-2100
- CSIRO: Commonwealth Scientific and Industrial Research Organisation , CSIRO-Mk2 model 1961-2100
- Hadley Centre: Hadley Centre for Climate Prediction and Research , HADCM3 model 1950-2099
- GFDL: Geophysical Fluid Dynamics Laboratory , R30 Model 1961-2100
- MPI-M: Max Planck Institute für Meteorologie , ECHAM4/OPYC coupled model 1990-2100
- NCAR PCM: National Centre for Atmospheric Research , PCM model 1980-2099
- NCAR CSM: National Centre for Atmospheric Research , CSM Model 2000-2099
Copyright
This figure was created by Robert A. Rohde from public data and is incorporated into the Global Warming Art project.
This image is an original work created for Global Warming Art.
Permission is granted to copy, distribute and/or modify this image under either:
- The GNU Free Documentation License Version 1.2; with no Invariant Sections, Front-Cover Texts, or Back-Cover Texts.
- The Creative Commons Attribution-NonCommercial-ShareAlike License Version 2.5
Please refer to the image description page on Global Warming Art for more information
- http://www.globalwarmingart.com/wiki/Image:Global_Warming_Predictions.png
File history
Legend: (cur) = this is the current file, (del) = delete this old version, (rev) = revert to this old version.
Click on date to download the file or see the image uploaded on that date.
- (del) (cur) 22:19, 3 December 2005 . . Dragons flight ( Talk | contribs) . . 528×377 (25,593 bytes) (Predicted global warming tempearture change under the SRES A2 emissions scenario.)
-
Edit this file using an external application
See the setup instructions for more information.
File links
- Global climate model
- User:Dragons flight/Images
- Talk:Extreme weather
- Global warming
- Image:Global Warming Predictions Map 2.jpg
- Image:Risks and Impacts of Global Warming.png
- User talk:Blue Tie/Article to work
- Wikipedia:Reference desk/Archives/Science/2006 November 27
Category: Global Warming Art images