Image:Radiative-forcings.svg
From Wikipedia, the free encyclopedia
Radiative-forcings.svg (600 × 480 pixel, file size: 58 KB, MIME type: image/svg+xml)
Contents |
Summary
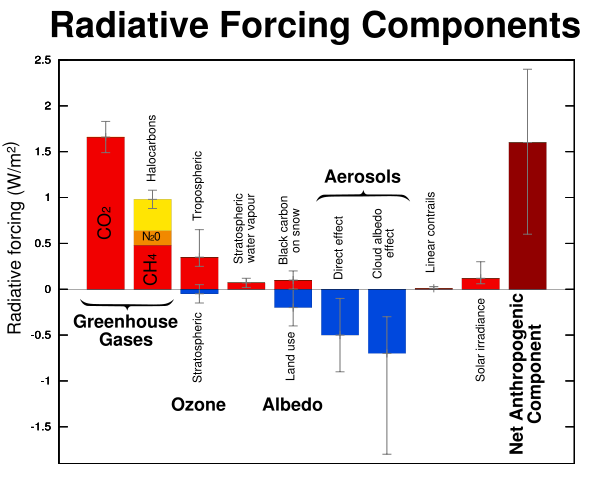
Global average radiative forcing estimates and ranges in 2005 for anthropogenic greenhouse gases and other important agents and mechanisms.
Understanding global warming requires understanding the changes in climate forcings that have occurred since the industrial revolution. These include positive forcing from increased greenhouse gases negative forcing from increased sulphate aerosols and poorly constrained forcings from indirect areosol feedbacks as well as minor contributions from solar variability and other factors. The poorly constrained aerosol effects results from both limited physical undersanding of how aerosols interact with the atmosphere and limited knowledge of aerosol concentrations during the pre-industrial period. This is a significant source of uncertainty in comparing modern climate forcings to past states.
Contrary to the impression given by this figure, it is not possible to simply sum the radiative forcing contributions from all sources and obtain a total forcing. This is because different forcing terms can interact to either amplify or interfere with each other. For example, in the case of greenhouse gases, two different gases may share the same absorption bands thus partially limiting their effectiveness when taken in combination.
Licensing
This figure was produced by Leland McInnes using gnuplot and Inkscape and is licensed under the GFDL. All data is from publicly available sources.

I, the creator of this work, hereby grant the permission to copy, distribute and/or modify this document under the terms of the GNU Free Documentation License, Version 1.2 or any later version published by the Free Software Foundation; with no Invariant Sections, no Front-Cover Texts, and no Back-Cover Texts.
Subject to disclaimers.
Data Sources
The figures used the generate this plot were obtained from the IPCC Working Group I Fourth Assessment Report Summary for Policymakers, page 16.
Related Images
 Similar plot from the IPCC Third Assessment report.
|
File history
Legend: (cur) = this is the current file, (del) = delete this old version, (rev) = revert to this old version.
Click on date to download the file or see the image uploaded on that date.
- (del) (cur) 00:17, 4 February 2007 . . Leland McInnes ( Talk | contribs) . . 600×480 (59,776 bytes)
- (del) (rev) 22:59, 3 February 2007 . . Leland McInnes ( Talk | contribs) . . 600×480 (58,978 bytes)
-
Edit this file using an external application
See the setup instructions for more information.
File links
- Ozone depletion
- Radiative forcing
- Talk:Wind power
- User:Leland McInnes/Images
- Image:IPCC Radiative Forcings.png
- User talk:Blue Tie/Article to work
Category: User-created GFDL images