Image:Solar Activity Proxies.png
From Wikipedia, the free encyclopedia

Solar_Activity_Proxies.png (559 × 361 pixel, file size: 29 KB, MIME type: image/png)
Description
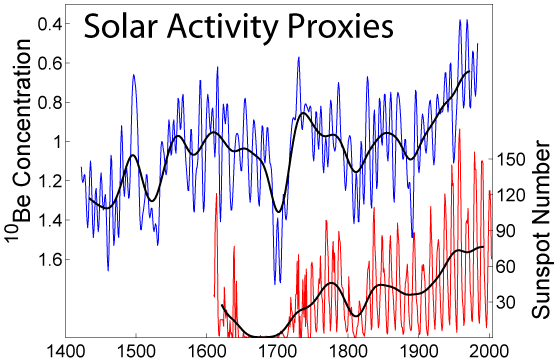
This figure shows two different proxies of solar activity during the last several hundred years. In red is shown the Group Sunspot Number (Rg) as reconstructed from historical observations by Hoyt and Schatten (1998a, 1998b) . In blue is shown the beryllium-10 concentration (104 atoms/(gram of ice)) as measured in an annually layered ice core from Dye-3, Greenland (Beer et al. 1994).
Both of these proxies are related to solar magnetic activity. Sunspots are darker, cooler regions of the sun's surface associated with high magnetic flux. Higher numbers of sunspots indicate a more active sun with stronger and more complicated magnetic fields. The dominant change in sunspots reflects the quasi-11 year solar magnetic cycle. The quiet period observed from 1645 to 1710 is known as the Maunder Minimum and is associated with a near zero abundance of sunspots.
Beryllium-10 is a cosmogenic isotope created in the atmosphere by galactic cosmic rays. Because the flux of such cosmic rays is affected by the intensity of the interplanetary magnetic field carried by the solar wind, the rate at which Beryllium-10 is created reflects changes in solar activity. A more active sun results in lower beryllium concentrations (note inverted scale on plot). Since the atmospheric residence time for beryllium is not more than a few years, it is also possible to resolve the solar magnetic cycle in beryllium concentrations. Beryllium measurements, such as these, are the best evidence that the solar magnetic cycle did not cease even during the period with no evident sunspots.
The dark curves are 30 year averages of the data.
Copyright
This image was produced by Robert A. Rohde from previously published data and is incorporated into the Global Warming Art project.
This image is an original work created for Global Warming Art.
Permission is granted to copy, distribute and/or modify this image under either:
- The GNU Free Documentation License Version 1.2; with no Invariant Sections, Front-Cover Texts, or Back-Cover Texts.
- The Creative Commons Attribution-NonCommercial-ShareAlike License Version 2.5
Please refer to the image description page on Global Warming Art for more information
- http://www.globalwarmingart.com/wiki/Image:Solar_Activity_Proxies.png
References
- Hoyt, D. V., and K. H. Schatten (1998a) Group sunspot numbers: A new solar activity reconstruction. Part 1. Solar Physics, 179, 189-219.
- Hoyt, D. V., and K. H. Schatten (1998b) Group sunspot numbers: A new solar activity reconstruction. Part 2. Solar Physics, 181, 491-512.
- J.Beer, St.Baumgartner, B.Dittrich-Hannen, J.Hauenstein, P.Kubik, Ch.Lukasczyk, W.Mende, R.Stellmacher and M.Suter (1994) Solar Variability Traced by Cosmogenic Isotopes in The Sun as a Variable Star: Solar and Stellar Irradiance Variations (eds. J.M. Pap, C. Fröhlich, H.S. Hudson and S.K. Solanki), Cambridge University Press, 291-300.
File history
Legend: (cur) = this is the current file, (del) = delete this old version, (rev) = revert to this old version.
Click on date to download the file or see the image uploaded on that date.
- (del) (cur) 21:20, 12 March 2005 . . Dragons flight ( Talk | contribs) . . 559×361 (29,422 bytes) (Solar Activity Proxies {{gfdl}})
-
Edit this file using an external application
See the setup instructions for more information.
File links
- Beryllium
- Maunder Minimum
- Climate change
- Solar variation
- Image:Solar-cycle-data.png
- User:Dragons flight/Images
Categories: Global Warming Art images | Solar phenomena