Image:Sunspot Numbers.png
From Wikipedia, the free encyclopedia

Size of this preview: 800 × 340 pixel
Image in higher resolution (1000 × 425 pixel, file size: 42 KB, MIME type: image/png)
Description
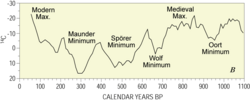
This figure summarizes the 400 years of regular sunspot number observations. Since ~1749, continuous monthly averages of sunspot activity have been available and are shown here as reported by the Solar Influences Data Analysis Centre, World Data Centre for the Sunspot Index, at the Royal Observatory of Belgium. These figures are based on an average of measurements from many different observatories around the world. Prior to 1749, sporadic observations of sunspots are available. These were compiled and placed on consistent monthly framework by Hoyt & Schatten (1998a, 1998b).
The most prominent feature of this graph is the ~11 year solar magnetic cycle which is associated with the natural waxing and waning of solar activity.
On longer time scales, the sun has shown considerable variability, including the long Maunder Minimum when almost no sunspots were observed, the less severe Dalton Minimum, and increased sunspot activity during the last fifty years, known as the Modern Maximum. The causes for these variations are not well understood, but because sunspots and associated faculae affect the brightness of the sun, solar luminosity is lower during periods of low sunspot activity. It is widely believed that the low solar activity during the Maunder Minimum and earlier periods may be among the principle causes of the Little Ice Age. Similarly, the Modern Maximum is partly responsible for global warming, especially the temperature increases between 1900 and 1950. Residual warming due to the sustained high level of activity since 1950 is believed responsible for 16 to 36% of recent warming (Stott et al. 2003).
Copyright
This figure was prepared by Robert A. Rohde and is part of the Global Warming Art project.
This image is an original work created for Global Warming Art.
Permission is granted to copy, distribute and/or modify this image under either:
- The GNU Free Documentation License Version 1.2; with no Invariant Sections, Front-Cover Texts, or Back-Cover Texts.
- The Creative Commons Attribution-NonCommercial-ShareAlike License Version 2.5
Please refer to the image description page on Global Warming Art for more information
- http://www.globalwarmingart.com/wiki/Image:Sunspot_Numbers.png
References
- Hoyt, D. V., and K. H. Schatten (1998a). "Group sunspot numbers: A new solar activity reconstruction. Part 1.". Solar Physics 179: 189-219.
- Hoyt, D. V., and K. H. Schatten (1998b). "Group sunspot numbers: A new solar activity reconstruction. Part 2.". Solar Physics 181: 491-512.
- Stott, Peter A.; Gareth S. Jones and John F. B. Mitchell (15 December 2003). " Do Models Underestimate the Solar Contribution to Recent Climate Change". Journal of Climate 16: 4079-4093.
File history
Legend: (cur) = this is the current file, (del) = delete this old version, (rev) = revert to this old version.
Click on date to download the file or see the image uploaded on that date.
- (del) (cur) 01:14, 16 July 2006 . . Dragons flight ( Talk | contribs) . . 1000×425 (42,579 bytes)
- (del) (rev) 01:13, 16 July 2006 . . Dragons flight ( Talk | contribs) . . 950×403 (40,229 bytes) ({{GWArt}})
-
Edit this file using an external application
See the setup instructions for more information.
File links
- Global warming controversy
- Sunspot
- Maunder Minimum
- Solar variation
- Image:Solar-cycle-data.png
- User:Dragons flight/Images
- Modern Maximum
- Image:Carbon14 with activity labels.svg
Category: Global Warming Art images