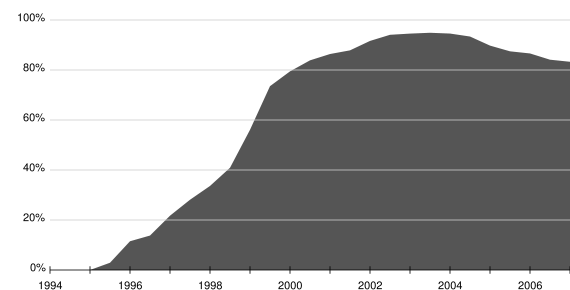
Image:Internet-explorer-usage-data.svg
From Wikipedia, the free encyclopedia

Internet-explorer-usage-data.svg (570 × 290 pixel, file size: 4 KB, MIME type: image/svg+xml)
Contents |
Summary
Editing this file
This file is in SVG format. That means you can edit it with a text editor or an SVG-compatible graphics editor. However, you will find it better to use a text editor because otherwise your edits will be too imprecise.
Adding new data
If the data is between 1996 and 2006, just find that point in the file and update it. For example, at the moment the code for the usage statistics between 2000 and 2001 looks like this:
L 2000,83.75
L 2001,90
To insert data for the midpoint of 2000, just make it look like this:
L 2000,83.75
L 2000.5,86
L 2001,90
If you are adding data for before 1996 or after 2006, you'll need to change the transformations on the groups. This requires moderately detailed understanding of SVG. Seek help if you need it.
Source
The original graph is at Image:Internet Explorer usage share.png. That is the original source of the data. The data at the time of this SVG's creation was:
"Date","Percentage"
1996,3.75
1997,17.5
1998,35
1999,62.5
2000,83.75
2001,90
2002,95.25
2003,94.75
2004,92.625
2005,86.903861
2006,1
El T 13:11, 25 June 2006 (UTC)
Licensing

I, the creator of this work, hereby release it into the public domain. This applies worldwide.
In case this is not legally possible,
I grant any entity the right to use this work for any purpose, without any conditions, unless such conditions are required by law.
|
|
This picture/multimedia file is now available on Wikimedia Commons as Image:Internet-explorer-usage-data.svg. Images which have been tagged with this template may be deleted immediately after satisfying these conditions ( CSD I8). |
File history
Legend: (cur) = this is the current file, (del) = delete this old version, (rev) = revert to this old version.
Click on date to download the file or see the image uploaded on that date.
- (del) (cur) 14:08, 2 February 2007 . . Schapel ( Talk | contribs) . . 570×290 (4,065 bytes) (New graph created from data in the usage share article)
- (del) (rev) 14:58, 17 August 2006 . . Henrikb4 ( Talk | contribs) . . 566×290 (3,084 bytes)
- (del) (rev) 13:11, 25 June 2006 . . El T ( Talk | contribs) . . 566×290 (3,108 bytes) (An SVG version of the graph. The easiest way to update the graph is to use a TEXT editor, NOT a graphics one. Just find the list of numbers and add in the statistic you want to use. Just make sure you put them in order. If you are adding data for before )
-
Edit this file using an external application
See the setup instructions for more information.
File links
- Internet Explorer
- Comparison of web browsers
- Image:Internet Explorer usage share.png
Categories: User-created public domain images | Images with the same name on Wikimedia Commons as of 2 April 2007 | All images with the same name on Wikimedia Commons