Image:Phanerozoic Sea Level.png
From Wikipedia, the free encyclopedia
Phanerozoic_Sea_Level.png (523 × 360 pixel, file size: 23 KB, MIME type: image/png)
Contents |
Description
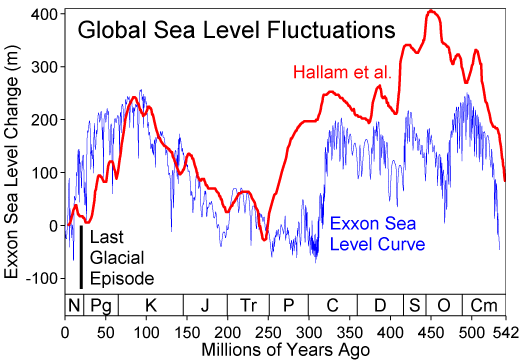
This figure compares the Hallam et al. (1983) and Exxon eustatic (global) sea level reconstructions for the Phanerozoic eon. The Exxon curve is a composite from several reconstructions published by the Exxon corporation (Haq et al. 1987, Ross & Ross 1987, Ross & Ross 1988). Both curves are adjusted to the 2004 ICS geologic timescale.
Hallam et al. and Exxon use very different techniques to measuring global sea level changes. Hallam's approach is qualitative and relies on regional scale observations from exposed geologic sections and estimates of the areas of flooded continental interiors. Exxon's approach relies on the interpretation of seismic profiles to determine the extent of coastal onlap in subsequently buried sedimentary basins. Hallam is insensitive to rapid fluctuations in sea level. Exxon is sensitive to rapid fluctuations but tends to overinterpret local geologic changes resulting in bias towards reporting unphysical rapid fluctuations.
The depth scale is as reported by Exxon. Because Hallam is reported as qualtitative (i.e. uncalibrated), these sea level changes were scaled to match the Exxon record during the period 0-250 Myr.
A black bar is added to indicate the scale of sea level fluctuations during the last glacial/interglacial transition. This change occurred purely within the last 20 kyrs, and note that neither system of measurements is capable of resolving changes on this time scale. It also should be noted that very rapid fluctuations of similar scale are potentially possible during all periods during which large scale ice sheets are present (see: Phanerozoic climate change).
On the scale of this figure, the melting of all existing ice sheets would result in a sea level rise of ~80 meters. Changes on larger scales, which evidently occurred many times in the past, are the result of geologic changes in the structure of ocean basins. Essentially, such changes affect the average depth of the oceans relative to the continents.
Common symbols for geologic periods appear at the bottom.
Copyright
This figure was prepared by Robert A. Rohde from publicly available data and is incorporated into the Global Warming Art project.
This image is an original work created for Global Warming Art.
Permission is granted to copy, distribute and/or modify this image under either:
- The GNU Free Documentation License Version 1.2; with no Invariant Sections, Front-Cover Texts, or Back-Cover Texts.
- The Creative Commons Attribution-NonCommercial-ShareAlike License Version 2.5
Please refer to the image description page on Global Warming Art for more information
- http://www.globalwarmingart.com/wiki/Image:Phanerozoic_Sea_Level.png
References
- Hallam, A., Phil. Trans. Royal Soc. B 325, 437-455 (1989).
- Harland, W.B. and many others, A Geologic Time Scale, (1982).
- Haq, B., J. Hardenbol, P. Vail., Science, 235, 156-1167 (1987).
- Ross, C.A. & J.R.P. Ross, Cushman Foundation for Foraminiferal Research Spec. Publ. 24, 137-149 (1987).
- Ross, C.A. & J.R.P. Ross in Sea-level Change: an Integrated Approach (Eds. Wilgus, C.K., Hastings, B.J., Posamentier, H., van Wagoner, J.C., Ross, C.A., and Kendall, C.G. St. C.), SEPM Spec. Pub. 42:71-108 (1988).
Notes
- Because Exxon traditionally used an in-house (i.e. unpublished) system for estimating the geologic age of stratigraphic sections it is not possible to perform an exact recalibration of the time scale. Instead it was adjusted assuming the Harland et al. 1982 time scale was a reasonable approximation.
File history
Legend: (cur) = this is the current file, (del) = delete this old version, (rev) = revert to this old version.
Click on date to download the file or see the image uploaded on that date.
- (del) (cur) 06:34, 7 March 2005 . . Dragons flight ( Talk | contribs) . . 523×360 (23,950 bytes) (Phanerozoic Sea Level Changes)
-
Edit this file using an external application
See the setup instructions for more information.
File links
- Sea level rise
- Sea level
- Sequence stratigraphy
- User:Dragons flight/Images
Category: Global Warming Art images