Image:Pu-phases.png
From Wikipedia, the free encyclopedia
- Image
- File history
- File links
Pu-phases.png (350 × 441 pixel, file size: 19 KB, MIME type: image/png)
|
|
This is a file from the Wikimedia Commons. The description on its description page there is shown below. |
|
|
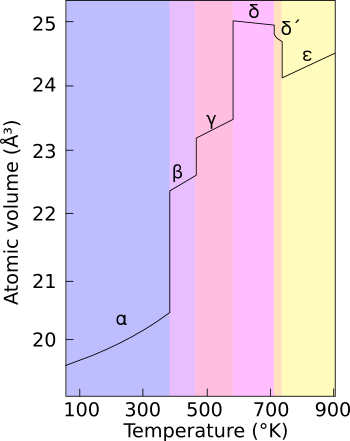
Phase diagram for plutonium at ambient pressure. The vertical axis is the average atomic volume, in cubic angstroms.
Based on the data in the diagram in Ambient pressure phase diagram of plutonium - A unified theory for $\alpha $-Pu and $\delta $-Pu, P. Söderlind, Europhys. Lett., 55 (4), p. 525 (2001).
Source: http://resourcescommittee.house.gov/subcommittees/emr/usgsweb/photogallery/ ; English Wikipedia, original upload 28 April 2005 by Aarchiba
 |
I, the copyright holder of this work, hereby release it into the public domain. This applies worldwide. In case this is not legally possible: Afrikaans | Alemannisch | Aragonés | العربية | Български | Català | Česky | Cymraeg | Dansk | Deutsch | Ελληνικά | English | Español | Esperanto | Euskara | فارسی | Français | Galego | 한국어 | हिन्दी | Hrvatski | Ido | Bahasa Indonesia | Íslenska | Italiano | עברית | Kurdî / كوردي | Latina | Lietuvių | Magyar | Bahasa Melayu | Nederlands | Norsk (bokmål) | Norsk (nynorsk) | 日本語 | Polski | Português | Ripoarish | Română | Русский | Shqip | Slovenčina | Slovenščina | Српски | Svenska | ไทย | Türkçe | Українська | Tiếng Việt | Walon | 简体中文 | 繁體中文 | 粵語 | +/- |
File links