During my semester project, I was faced with the task of processing a large data set (6 TB) consisting of all the revisions in the English Wikipedia till October 2016. We chose Apache Spark as our cluster-computing framework, and hence I ended up spending a lot of time working with it. In this post, I want to share some of the lessons I learned throughout the use of PySpark, Spark’s Python API.
Spark is a framework to build and run distributed data manipulation algorithms, designed to be faster, easier and to support more types of computations than Hadoop MapReduce. In fact, Spark is known for being able to keep large working datasets in memory between jobs, hence providing a performance boost that is up to 100 times faster than Hadoop.
Although it is written in Scala, Spark exposes the Spark programming model to Java, Scala, Python and R. While I had the opportunity to develop some small Spark applications in Scala in a previous class, this was the first time I had to handle this amount of data and we agreed to use the PySpark API, in Python, as Python is now become the lingua franca for data science applications. Moreover, using the Python API has a negligible performance overhead compared to the Scala one.
PySpark
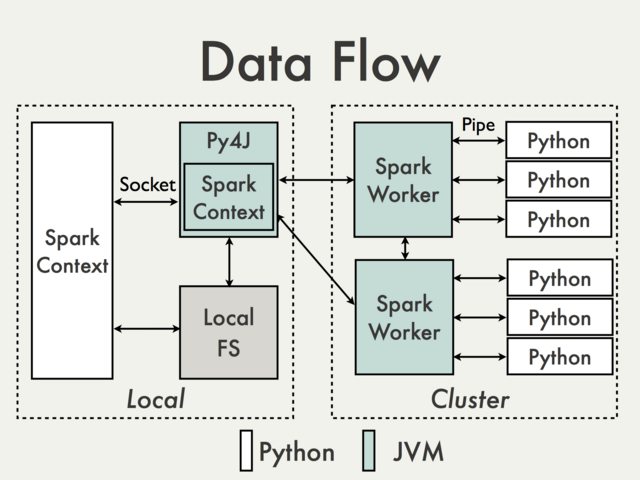
PySpark is actually built on top of Spark’s Java API. In the Python driver program, SparkContext uses Py4J to launch a JVM which loads a JavaSparkContext that communicates with the Spark executors across the cluster.
Python API calls to the SparkContext object are then translated into Java API calls to the JavaSparkContext, resulting in data being processed in Python and cached/shuffled in the JVM.

RDD (Resilient Distributed Datasets) is defined in Spark Core, and it represents a collection of items distributed across the cluster that can be manipulated in parallel.
PySpark uses PySpark RDDs which are just RDDs of Python objects, such as lists, that might store objects with different types. RDD transformations in Python are then mapped to transformations on PythonRDD objects in Java.
Spark SQL and DataFrames
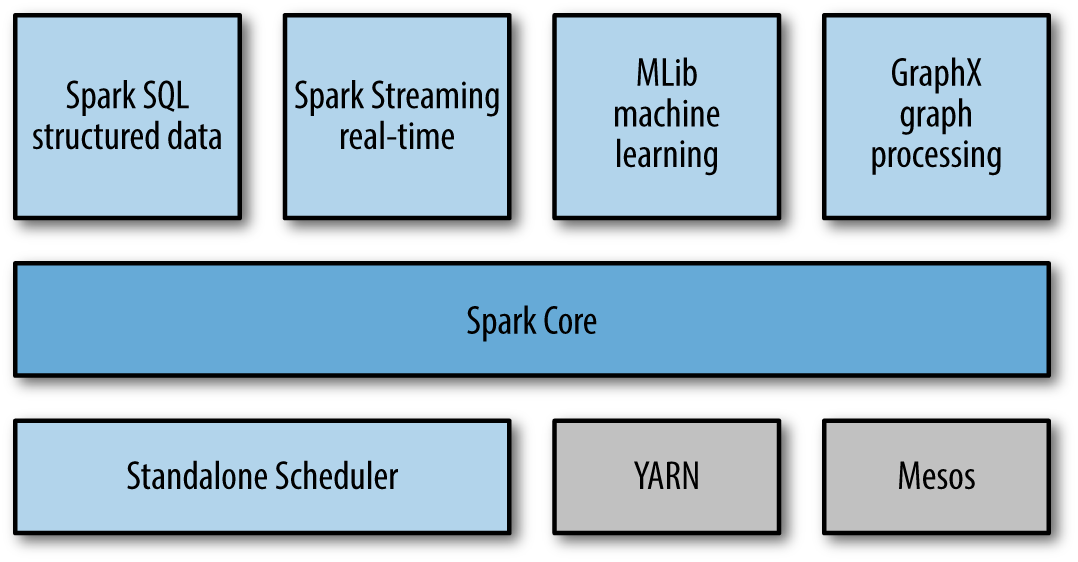
At its core, Spark is a computational engine that is responsible for scheduling, distributing, and monitoring applications consisting of many computational tasks on a computing cluster. In addition, Spark also supports a rich set of higher-level tools including Spark SQL for SQL and structured data processing, MLlib for machine learning, GraphX for graph processing, and Spark Streaming.

Whenever analyzing (semi-)structured data with Spark, it is strongly suggested to make use of Spark SQL: The interfaces provided by Spark SQL enrich Spark with more information about the structure of both the data and the computation being performed, and this extra information is also used to perform further optimizations. There are several ways to interact with Spark SQL including SQL, the DataFrames API and the Datasets API. In my project, I only employed the DataFrame API as the starting data set is available in this format.
A DataFrame is a distributed collection of data (a collection of rows) organized into named columns. It is based on the data frame concept in R or in Pandas, and it is similar to a table in relational database or an Excel sheet with column headers.
DataFrames can be constructed from a wide array of sources such as: structured data files, tables in Hive, external databases, or existing RDDs; and they also share some common characteristics with RDD: they are immutable, lazy and distributed in nature.
Implementation best practices
Broadcast variables. When you have a large variable to be shared across the nodes, use a broadcast variable to reduce the communication cost.
If you don’t, this same variable will be sent separately for each parallel operation. Also, the default variable passing mechanism is optimized for small variables and can be slow when the variable is large.
Broadcast variables allow the programmer to keep a read-only variable cached, in deserialized form, on each machine rather than shipping a copy of it with tasks.
The broadcast of variable v can be created by bV = sc.broadcast(v). Then value of this broadcast variable can be accessed via bV.value.
Parquet and Spark. It is well-known that columnar storage saves both time and space when it comes to big data processing. In particular, Parquet is shown to boost Spark SQL performance by 10x on average compared to using text.
Spark SQL provides support for both reading and writing parquet files that automatically capture the schema of the original data, so there is really no reason not to use Parquet when employing Spark SQL.
Saving the df DataFrame as Parquet files is as easy as writing df.write.parquet(outputDir). This creates outputDir directory and stores, under it, all the part files created by the reducers as parquet files.
Overwrite save mode in a cluster. When saving a DataFrame to a data source, by default, Spark throws an exception if data already exists. However, It is possible to explicitly specify the behavior of the save operation when data already exists. Among the available options, overwrite plays an important role when running on a cluster. In fact, it allows to successfully complete a job even when a node fails while storing data into disk, allowing another node to overwrite the partial results saved by the failed one.
For instance, the df DataFrame can be saved as Parquet files using the overwrite save mode by df.write.mode('overwrite').parquet(outputDir).
Clean code vs. performance. When processing a large amount of data, you may need to trade writing clean code for a performance boost. For instance, I once reported that filtering a specific array by creating a new one via list comprehension (one line) before processing it was an order of magnitude slower than writing a longer for loop containing the required conditional statements along with the processing steps. This is because a new array was being created and additional time to allocate it is required. While this might seem a negligible quantity, when the volume of data is huge, this can make the difference between a feasible and an unfeasible operation.
Process data in batches. While I was initially required to process our original DataFrame in batches due to the cluster configurations, this actually resulted in a very functional method to process data in later stages too. The partial results of each batch can then just be merged together and this approach can be very helpful as (i) some nodes might go down and lead your job to fail, forcing you to rerun it on the entire dataset; and (ii) this might be the only methodology to crunch your data if your application is memory-bounded. Moreover, merging all the partial DataFrame I obtained after each stage was an extremely fast and cheap operation, marginalizing the additional overhead.
Run multiple regexs in a cluster. This last point might cause you to jolt, and I was surprised when I found it out.
When you need to match multiple regex patterns, you usually pipe them (| operator) into a single one and go through a text only once. In fact, this is usually faster as reading from disk is expensive. For instance, in a sample data set I had in my laptop, this resulted in a 3-minute faster execution than running each regex separately (7 vs. 10 minutes). However, when I ran this experiment on a larger collection in a cluster, I noticed that running each regex separately was slightly faster than grouping them together. So, you can skip all the tests needed to ensure that the different regexs do not interfere with each other when grouped together and directly develop your application using multiple regexs.
Tuning your Spark application

I spent most of my time in tuning the amount of resources required to successfully complete different jobs. While asking for an insufficient amount of memory might lead a job to fail, requesting unnecessary resources comes with a cost that might be significant for long runs. In general, it is important to understand how to properly determine the amount of resources required to run a given job.
The most relevant settings are:
--num-executors: number of executors requested--executor-cores: number of cores per executor requested--executor-memory: executor JVM heap size--conf spark.yarn.executor.memoryOverhead: determines full memory request (in MB) to YARN for each executor. Default: max(384, 0.07*spark.executor.memory)--driver-memoryand--driver-cores: resources for the application master

When using PySpark, it is noteworthy that Python is all off-heap memory and does not use the RAM reserved for heap. In fact, recall that PySpark starts both a Python process and a Java one. The Java process is what uses heap memory, while the Python process uses off heap. So, you may need to decrease the amount of heap memory specified via --executor-memory to increase the off-heap memory via spark.yarn.executor.memoryOverhead.
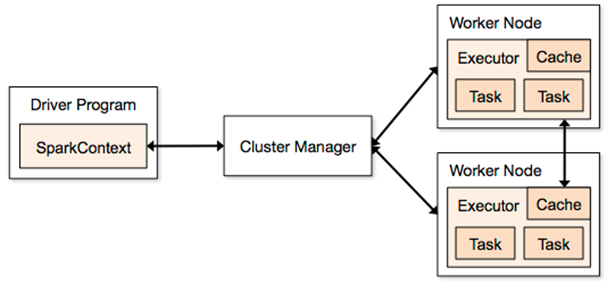
Also, running tiny executors (with a single core, for example) throws away benefits that come from running multiple tasks in a single JVM. For instance, broadcast variables need to be replicated once on each executor, so many small executors will result in many more copies of the data.
The number of cores you configure is another important factor as it affects the number of concurrent tasks that can be run in memory at one time. This in turn affects the amount of execution memory being used by each tasks as it is shared between them. For example, with 12GB heap memory running 8 tasks, each one roughly gets about 1.5GB.
So, how do I tune my Spark application? My suggestion is to start with a per-core mindset and then scale out. Consider, for instance, the IC Hadoop cluster with 7 nodes, each equipped with 38 VCores and 238 GB of RAM.
- Start by running a single-core worker executor per node and try to estimate the amount of memory it might be needed by a single core to process your data without failing.
- Once you have determined the memory requirements of your application, you can increase the number of cores per executor to N while assigning each of them roughly N times the memory you established. As I said before, having more cores per executor allows to have some benefits as they run in a single JVM, but too many cores per executor might slow you down at writing time. Hence, this is a value that strongly depends on your application.
- You can then scale out in terms of number of executors with the constraints of the number of available cores and RAM per machine (respectively, up to 38 and 238GB in our case if your are the only user of the cluster). Moreover, recall that an additional container is used by the driver.
Common errors and how to fix them
When developing your Spark application, you come across very long stack traces whenever an exception is raised. Hence, it might be a bit difficult to find the cause of your error and how to solve it, especially when this is due to resource allocation. Here are presented some of the most frequently errors I met during my semester project and what I did to fix them.
-
… Consider boosting spark.yarn.executor.memoryOverhead. When this message is displayed, just request a larger amount of off heap memory via
--conf spark.yarn.executor.memoryOverhead=<N_MB>, where<N_MB>is the number of MB requested per executor. -
java.lang.OutOfMemoryError: Java heap spacejava.lang.OutOfMemoryError: GC overhead limit exceededWhen either of these errors is thrown, consider boostingdriver-memoryand/orexecutor-memory. In particular, requesting a larger amount of the driver memory might seem counterintuitive in some context but can actually solve the problem without requesting a larger amount of memory for each executor. -
java.lang.NullPointerExceptionWhen this exception is raised, the cause might be in the cluster itself. I came across this expection when the service was down in one of the cluster, and when there was no storage left in my output directory. -
Serialized results … is bigger than spark.driver.maxResultSize When this message is displayed, just set a larger maximum size for a variable that needs to be collected at the driver via
--conf spark.driver.maxResultSize=<N>G, where<N>is the number of GB requested.
Conclusions
Determining the correct amount of resources requested by a Spark application might take more time than you expect. This post intends to give you some insights on how to reduce it by firstly looking at single-core executors and then scaling out, as the memory assigned to each executor is, more or less, equally split among its cores.
Other take-aways are the internal structure of PySpark and its off-heap memory requirements, which I was initially unaware of, and the lists of best practices and of common errors that sprouted during my semester-long research.
These were overall the tasks were I spent most of my time. There are different resources online that can help you get a better understanding of what is going under the hood when you run a Spark application, but information is scattered among several sources and might take you a while to extract the piece you are looking for. Had I had this post available at the time of my semester project, it would have saved me substantial amount of searching time, and I hope this can actually be helpful to you!