[A research paper about this research has been published at The Web Conference 2018: When Sheep Shop: Measuring Herding Effects in Product Ratings with Natural Experiments]
Imagine you’re visiting a town for the first time, and after walking around all morning seeing the sights, you find yourself in a square in front of a bakery that sells delicious-smelling croissants. Actually, there are two bakeries in the square, one on either side of it. In front of bakery 1, there’s a line of about a dozen people, whereas bakery 2 is all empty. Which bakery would you choose?
You might tell yourself, “Clearly there must be a reason why everyone prefers bakery 1,” and you might choose to enter the line even though it would take longer until you’d get served. Just as sheep, humans, too, sometimes like to follow their herd, which is why this behavior has been called “herding”.
If herding really happens, it can have severe effects, by amplifying minor initial fluctuations into major permanent outcomes. For instance, the line in front of bakery 1 might have formed because a tour bus dropped off a group of tourists there, for no specific reason, simply because the driver had to choose some place for his hungry passengers. He might as well have chosen bakery 2. Now, passers-by see that bakery 1 is packed, not knowing that all the customers came out of the same bus. They think, “Wow, this bakery must be phenomenal, I should try it out,” and by doing so, they make the line even longer. It’s a domino effect from there onward.
The same problem exists on the Web. Online shopping is amazingly convenient; every product is but one click away. The downside, however, is that online shopping is a less direct experience than going to an offline, brick-and-mortar store. In a real bakery, you can smell the croissants, you can sample the bread, before deciding if you want to buy something. Online, you can’t do that. Therefore, we increasingly rely on reviews provided by previous customers instead. This, in turn, puts online shoppers in a delicate situation: if the first few reviews of a product happen to swing a certain way (or are purposefully engineered that way in an act of review spamming), this might unduly skew subsequent reviews according to the same chain of events we saw in front of that bakery.
Herding is therefore a behavior of great interest both sociologically as well as economically. Studying it precisely is hard, however, due to the lack of counterfactuals: How can we tell whether there has been herding in the reviews for a product, given that we don’t know what would have happened if the first reviews had been different?
In this post, we address this challenge with a neat methodology based on a natural experiment. The trick is to study not a single product review website, but two of them in parallel. In particular, we will observe how the same product is rated indendently on two separate websites, and if the product happens to receive a vastly different first rating on website 1, compared to website 2, we can measure how the first rating affects subsequent ones. This way, our setup allows us to confirm the existence of herding in online reviews and to precisely quantify how much of a difference it really makes.
In our bakery example, this would roughly correspond to having two parallel universes, one in which the tour bus drops its passengers off in front of bakery 1, and another one in which it drops them off in front of bakery 2, which would allow us to see how the bus driver’s random choice affects the business of the two bakeries.
The products we study here, however, aren’t croissants, but beers, for three reasons. First, there are two big websites where users review beers, RateBeer and BeerAdvocate. Second, it’s straightforward to write a program to figure out which beer on one website corresponds to which beer on the other website (by comparing beer and brewery names etc.), such that we can easily track the same beer across sites. And third, well, we like beer better than croissants.
A natural experiment
To explain the basic idea behind our study, let’s start with an example. Consider a new beer B that has become available just recently. The RateBeer user who is the first to rate beer B on RateBeer happens to love it, so they give it a very high score. The BeerAdvocate user who is the first to rate beer B on BeerAdvocate, on the contrary, happens to hate it, so they give it a very low score.
Of course, the inherent, “objective” quality of beer B was exactly the same for both users, and each user was the first to review beer B on the respective site, so they weren’t influenced by previous opinions. It’s only due to chance that the first RateBeer review was high, and the first BeerAdvocate review low, and not the other way round. More generally, whenever the same beer gets a high first review on one site, and a low first review on the other site, it’s essentially random whether the high first review happens on RateBeer or BeerAdvocate.
This means that nature has created a little experiment for us: she has flipped a coin to decide on which of the two sites beer B was to be exposed to the experimental condition “high first review”, and on which to the experimental condition “low first review”. And we as researchers may now analyze which effects the two experimental conditions have on subsequent reviews of beer B. In the presence of herding, subsequent reviews on the site with the high first review should on average be higher than on the site with the low first review. Conversely, in the absence of herding, the subsequent reviews should on average be similar regardless of the first rating.
Preparing the data
Now that we have laid out the general line of attack, let’s finally dig into the data, which consist of the first ten years’ worth of reviews from both RateBeer and BeerAdvocate (obtained from here). On both sites, beers receive scores ranging from 1.0 to 5.0. We discretize this range into three levels, “high” (H), “medium” (M), and “low” (L). A rating is defined as H if it’s in the top 15% of the ratings on the respective site, and as L if it’s in the bottom 15%. The remaining 70% are defined as M.
There are 7,424 beers that were rated on both sites, and each of them falls into one of 6 classes: H-H, H-M, H-L, M-M, M-L, or L-L, where the two letters capture the ratings the beer received on the two sites as the respective first rating. For instance, H-H means that the beer received high ratings on both sites, and H-L that it received a high rating on one site, and a low rating on the other, etc.
The latter class, H-L, is actually the most interesting for us, according to the above discussion. Since it doesn’t occur all that often in practice, however, (only 155 out of 7,424 beers) we also study the less extreme cases, H-M (1,399 beers) and M-L (1,389 beers); i.e., we investigate if, on a site where a given beer received H (L) as a first rating, it received significantly higher (lower) subsequent reviews than on the site where it received M as a first rating. For completeness, we will also include the cases H-H, M-M, and L-L in our analysis.
Results
Our goal is to quantify how the first rating influences subsequent ratings.
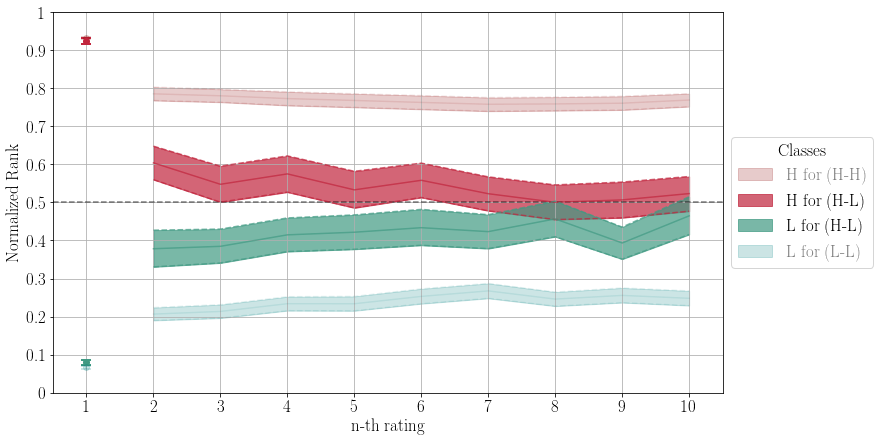
In the following figure, the dark curves summarize the ratings of beers that received a high first review on one site, and a low first review on the other site (H-L). It is computed only based on beers that received at least ten reviews. The x-axis captures the review number, ranging from the first to the tenth review. The dark red (dark green) curve corresponds to ratings received on the site with the high (low) first rating. For each review number n, it shows the average normalized rank of all n-th reviews. To compute normalized ranks for a given site, we sort all beers on the site by their ratings and compute where in the ranking each beer falls. The top-ranked beer has normalized rank 1, the bottom-ranked beer has normalized rank 0.
The dark line at the center of a colored band corresponds to the actual average; the width of the band captures the 95% confidence interval (estimated using bootstrap resampling). The light curves correspond to beers that received either high or low first reviews on both sites (H-H and L-L).

What we see is clear evidence of herding. Recall that the dark red curve is computed based on exactly the same set of beers as the dark green curve. So the fact that the dark red curve lies significantly above the dark green curve means that a beer receives significantly higher (lower) subsequent reviews if the first review happened to be high (low). As we can see, on the site where a beer happens to receive a high first rating, it tends to placed in the top 50% of all beers for at least the next nine reviews, while the same beer tends to be placed in the bottom 50% on the site where it happened to receive a low first rating.
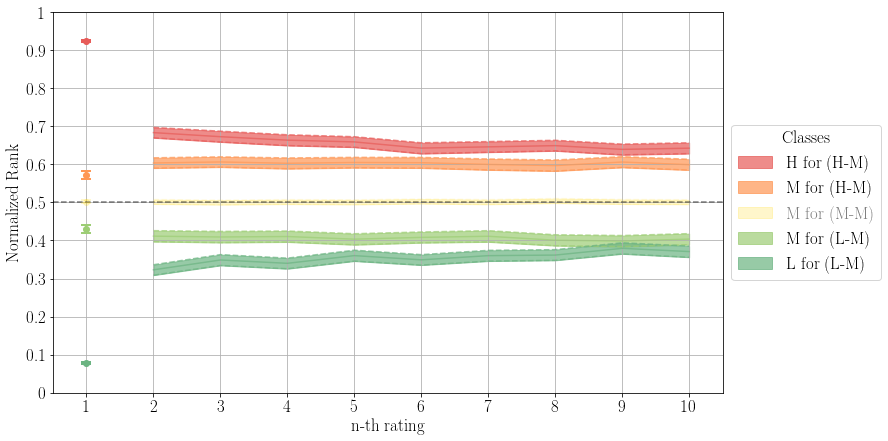
Our findings are corroborated when looking at the same kind of plot for the less extreme cases, i.e., beers that received a medium first review on one site (H-M), and a high first review on the other, or a medium first review on one site and a low first review on the other (M-L):

These findings let us conclude that the first rating significantly skews subsequent ratings. And by a lot. For instance, going back to the first figure, we see that a high first review is followed by a second review that ranks the beer on average a whopping 22% (60% vs. 38%) higher than it would if the first review had been low.
When we started this study, we didn’t expect to see results as extreme as this. Since the groups we compare to each other comprise the exact same beers, and since all beers in a group received the same combination of first reviews, it’s up to chance if a specific first review is higher or lower. Indeed, it might come down to random factors such as whether the sun was shining when the first reviewer tasted the beer, whether they had a bad stomach, or whether they had been in a fight with their husband.
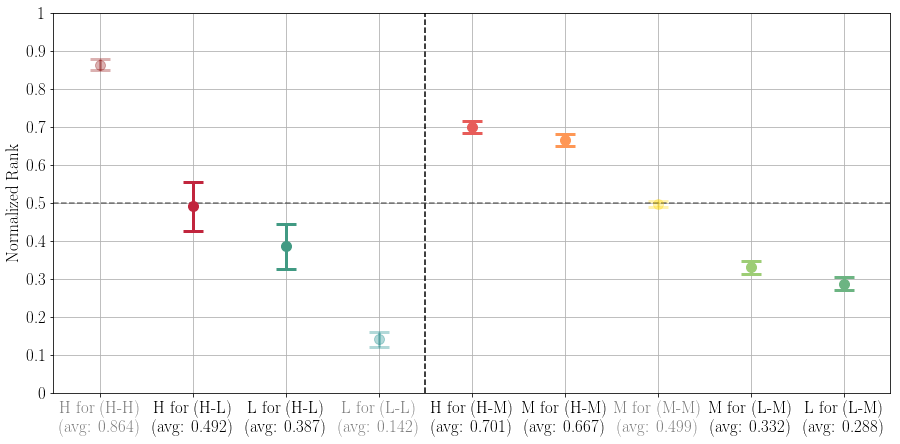
Maybe we could live with this if the system managed to swiftly “forget” the first reviews and to converge to the true, inherent quality of the beer being rated. To see whether this happens, we also studied the effect of the first rating in the longer run. We selected only those beers with at least 20 ratings and computed, for each beer, the average rating over all (not just the first 20) of its reviews. What we found, summarized in the following plot, should be rather unsettling for anyone who relies on review websites to decide what to buy: even after 20 or more ratings, beers that happened to receive a high first rating (symbolized by the dark red marker in the left panel of the plot) rank on average 10% higher than beers that happened to receive a low first rating (the dark green marker in the left panel of the plot).

For instance, the beer “Grain Belt Nordeast” received a high first rating (4.38/5.0) on BeerAdvocate and a low first rating (2.7/5.0) on RateBeer. At the time of writing, its average was 3.49/5.0 on BeerAdvocate (467 reviews), but only 2.59/5.0 on RateBeer (115 reviews), which translates into a normalized-rank difference of 13%.
The first rating kicks off a domino effect that is noticeable even much later. And since people rely on RateBeer and BeerAdvocate to decide which beers to buy, randomness among the first reviews can have tangible consequences for brewers.
So what?
We saw that herding is not just anecdotal. It really exists in online rating systems, and it has severe consequences. A single first rating can influence other users in a way that is reflected even much later. This means that the long-term average rating of a product does not truthfully reflect the inherent quality of a product.
Many rating websites have realized the dangers of herding, and have made attempts at countering them. For instance, both RateBeer and BeerAdvocate don’t show their so-called “overall scores” for beers that have received less than a certain number of reviews, due to the unreliability of averages computed from small numbers of reviews. However, as our analysis shows, this does not solve the problem.
So how could we solve the problem? Here’s a simple idea: hide all reviews (not only the “overall score”) of a product as long as it has received less than a minimum number of reviews. If, e.g., we hide reviews until we have at least ten of them, this will mean that we effectively collect ten first reviews that are independent of one another and not affected by herding. Once the eleventh reviewer comes around, they will see ten independent previous reviews, whose average will reflect the inherent quality of the product much more closely than any one single review. As a consequence, even if the eleventh reviewer is biased by previous ratings, they will be biased by something much less haphazard.
We think that this small change could significantly attenuate the negative effect of herding. To verify our hunch, we would love to conduct an A/B test on a real product rating website. Such a test would be straightforward to implement, but could lead the way to much improved rating systems, and ultimately to happier customers. And who doesn’t want to be happy when enjoying a cold one?