Demographics of Liberia
2007 Schools Wikipedia Selection. Related subjects: African Geography
| Republic of Liberia |
 |
|
History · Politics · Demographics |
The demographics of Liberia derive from Liberia's history as a place set up in 1821 as a colony for free slaves from the United States. The noun for a person from Liberia is Liberian(s). The adjective is Liberian.
Population
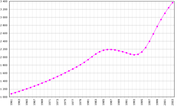
As of 2006, Liberia has the highest population growth rate in the world (4.91%). The current population is 3,042,004. There are an average of 6.43 children born per woman.
The birth rate is 47.22 births/1,000 population.
The death rate is 16.58 deaths/1,000 population. The infant mortality rate is 134.63 deaths/1,000 live births.
The net migration rate is 27.39 migrant(s)/1,000 population.
Age structure
0-14 years: 43% (male 681,136; female 680,501)
15-64 years: 54% (male 826,751; female 867,402)
65 years and over: 3% (male 54,334; female 54,032)
Sex ratio
at birth: 1.03 male(s)/female
under 15 years: 1 male(s)/female
15-64 years: 0.95 male(s)/female
65 years and over: 1.01 male(s)/female
total population: 0.98 male(s)/female
Life expectancy at birth
total population: 51.02 years
male: 49.6 years
female: 52.49 years (2000 est.)
Ethnic groups
There are 16 ethnic groups that make up Liberia's indigenous population: indigenous African tribes 95% (including Kpelle, Bassa, Gio, Kru, Grebo, Mandingo , Mano, Krahn, Gola, Gbandi, Loma, Kissi, Vai, and Bella), Americo-Liberians 2.5% (descendants of immigrants from the U.S. who had not been slaves), Congo People 2.5% (descendants of immigrants from the Caribbean who had not been slaves); About 5,000 persons of European descent.
The Kpelle in central and western Liberia is the largest ethnic group. Americo-Liberians, who are descendants of free-born and formerly enslaved African Americans that arrived in Liberia from 1822 onward, make up an estimated 5% of the population. There also is a sizable number of Lebanese, Indians, and other West African nationals who make up a significant part of Liberia's business community. Because of the civil war and its accompanying problem of insecurity, the number of Westerners in Liberia is low and confined largely to Monrovia and its immediate surroundings. The Liberian constitution restricts citizenship only to people of Negro descent.
Liberia was traditionally noted for its hospitality and academic institutions, iron mining and rubber industry booms, cultural skills and arts and craft works. But political upheavals beginning in the 1980s and the two civil wars (1989-96 and 1999-2003) brought about a steep decline in the living standards of the country, including its education and infrastructure.
Religions
Christian 40%, indigenous beliefs 40%, Muslim 20%
Languages
English 20% (official), some 20 ethnic group languages, of which a few can be written and are used in correspondence
Literacy
Literacy in Liberia, as defined as age 15 and over and can read and write, is:
total population: 38.3%
male: 53.9%
female: 22.4%
note: these figures are increasing because of the improving school system
